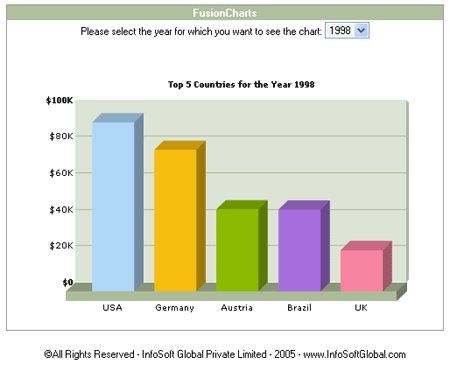
Previously, we had seen how to use the dataURL method to create a dynamic column chart using FusionCharts and ColdFusion. Here, we'll be creating the same chart but using dataXML method.
As we had earlier seen, the dataXML method just requires one page:
- Chart.cfm: This page contains everything - the year select drop down list, the chart and the XML data.
The above page is present in the downloads under the folder FusionCharts2_3 > Sample Code > DBExamples > CF > dataXML.
The page Chart.cfm is responsible for everything - rendering the year down box, getting the selected year, creating the XML data for that year and then rendering the chart for that year. The code for this page can be reproduced as under:
<html>
<head>
<title>FusionCharts Sample Template for Demo Application</title>
<link rel="stylesheet" href="../Style.css">
<!--- Get a list of years to display in top
drop down selection--->
<cfquery name="DataYears" datasource="q01nw">
SELECT DISTINCT YEAR(OrderDate) As Year
FROM Orders ORDER BY 1
</cfquery>
<cfloop query="DataYears">
<cfset lastYear = DataYears.Year>
</cfloop>
<!--- If no form has been submitted yet,
default year to first year from the query above --->
<cfparam name="Form.year" default="#lastYear#">
<cfset curYear = Val(Form.year)>
<cfquery name="Countries" datasource="q01nw">
SELECT TOP 5 Country, SUM(ExtendedPrice) As Total, COUNT(DISTINCT
OrderID) As orderNumber
FROM Invoices WHERE YEAR(OrderDate)= #curYear#
GROUP BY Country ORDER BY SUM(ExtendedPrice) DESC
</cfquery>
<cfset strXML = "<graph caption='Top 5 Countries for the year
" & curYear & "' shownames='1' showvalues='0' decimalPrecision='0'
numberPrefix='$'>">
<cfset strDataXML = "">
<cfset thisColor = 1>
<cfloop query="Countries">
<cfset mColor = Colors[(thisColor mod ArrayLen(Colors))]>
<cfset strDataXML = strDataXML & "<set
name='" & #Country# & "' hoverText='" & #Replace(Country,"'","`")#
& "' value='" & #Total# & "' color='"
& #mColor# & "'/>">
<cfset thisColor = thisColor + 1>
</cfloop>
<cfset StrXML = strXML & strDataXML & "</graph>">
</head>
<body>
<table width="500" border="0" cellpadding="2"
cellspacing="0" class="tableWithBorder" align='center'>
<tr>
<td colspan="3" class="trdark">
<div align="center"><span class="textboldlight">FusionChart
Demo Application</span>
</div>
</td>
</tr>
<form action="Chart.cfm" method="post">
<tr>
<td colspan="3" class="text" align="center">Please
select the year for which you want to see the reports:
<SELECT name='year' class='select' onChange="this.form.submit();">
<cfoutput query="DataYears">
<option value="#DataYears.Year#"
<cfif curYear Is DataYears.Year> selected</cfif>>
#DataYears.Year#
</option>
</cfoutput>
</SELECT>
</td>
</tr>
</form>
<tr>
<td colspan="3"> </td>
</tr>
<tr>
<td width="175" valign="top">
<table width="98%" border="0" cellspacing="0"
cellpadding="2">
<tr>
<td>
<table width="98%" border="0" cellspacing="0"
cellpadding="2">
<tr>
<td><div align="center" class="text">
<OBJECT classid="clsid:D27CDB6E-AE6D-11cf-96B8-444553540000"
codebase="http://download.macromedia.com/pub/shockwave/cabs/flash/swflash.cab#version=6,0,0,0"
WIDTH="450" HEIGHT="300" id="FC2Column"
ALIGN="">
<PARAM NAME="FlashVars" value="&dataXML=<cfoutput>#strXML#</cfoutput>">
<PARAM NAME=movie VALUE="../Charts/FC_2_3_Column3D.swf?chartWidth=450&ChartHeight=300">
<PARAM NAME=quality VALUE=high>
<PARAM NAME=bgcolor VALUE=#FFFFFF>
<EMBED src="../Charts/C_2_3_Column3D.swf?chartWidth=450&ChartHeight=300"
FlashVars="&dataXML=<cfoutput>#strXML#</cfoutput>"
quality=high bgcolor=#FFFFFF WIDTH="150" HEIGHT="150"
NAME="FC2Column" ALIGN="" TYPE="application/x-shockwave-flash"
PLUGINSPAGE="http://www.macromedia.com/go/getflashplayer"></EMBED>
</OBJECT>
</div></td>
</tr>
<tr>
<td> </td>
</tr>
</table>
</td>
</tr>
</table>
</td>
</tr>
</table>
<p align="center" class="text">©All
Rights Reserved - InfoSoft Global - 2004 - <a href="http://www.InfoSoftGlobal.com"
target="_blank">www.InfoSoftGlobal.com</a></p>
</BODY>
</html>
In the above code, we're doing the following:
- First, we're requesting a list of unique years from the database and rendering them in a drop down box. By default, we choose the last year as the selected year (i.e., the year for which we'll show the chart) and store it in the variable curYear. When the user selects a different year from the drop down box, the forms submits to this page only and the new requested year is stored in the variable curYear.
- We also initialize a variable strXML which would store the entire XML data document. We initialize the <graph> element in this string variable.
- strDataXML will be used to store the “<set>” elements.
- Next, we retrieve the recordset from the database and iterate through the records one by one. For each record, we add a <set> element in the format <set name='DataName' value='DataValue' color='HexCode' />. We get individual color codes for each data item from the list of colors that we had stored in the Colors array (Application.cfm).
- Thereafter, we add the ending </graph> element to the XML document (stored as string in strXML).
- Lastly, we embed the FusionCharts Chart in the CF page and convey the XML data using dataXML method.
When you now see Chart.cfm in your browser, you'll get the following output:
