Creating your first Chart > Basic Chart Elements
 
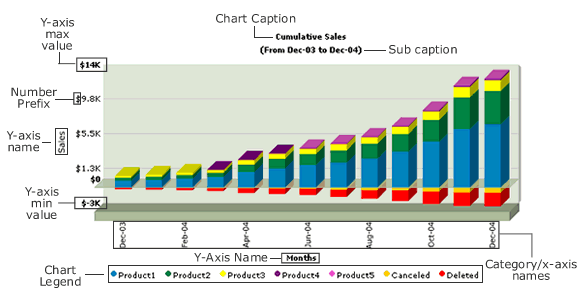
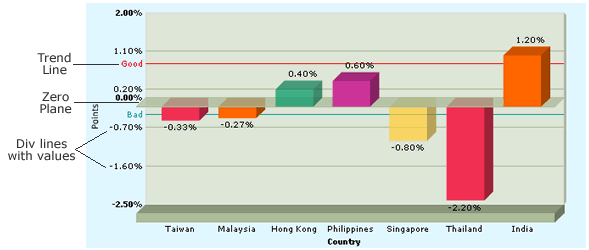
Here, we’ll see the various chart elements that constitute a chart. The following images would help you interpret the various sections of the chart.
 
Chart Background and Canvas

For a 3D chart, the canvas and background can be shown as under. You can change the colors and set the visibility of all the three elements below to false using XML attributes
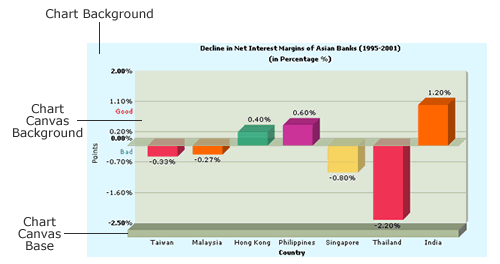
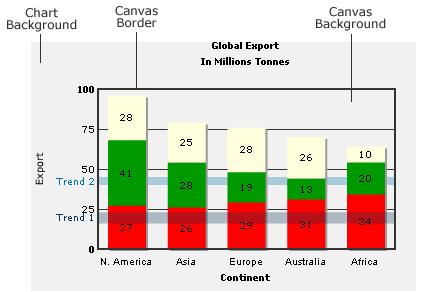
 
For a 2D chart, the canvas and background is shown below. You can set the canvas background color, background alpha, canvas border color, canvas border thickness, canvas background color via XML.
 
Chart Labels- caption, sub caption, x-axis label, y-axis label, y-axis upper limit, y-axis lower limit, number Prefix, number Suffix etc.
 
Div lines, trend lines and zero plane
 
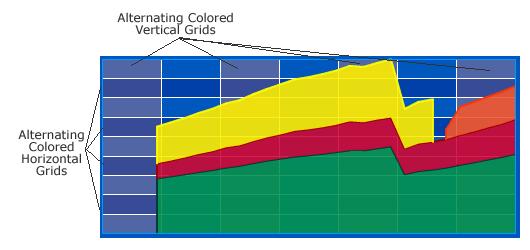
Alternating Colored Horizontal and vertical grids
You can choose colors and alphas for alternating horizontal and vertical grids.
 
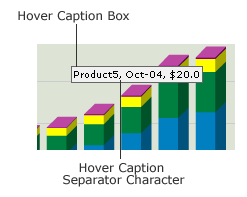
Hover Caption Box, hover caption background, hover caption border, hover caption data separator character.

You can define various properties for the hover caption box too - like border color, background color, separator character etc.
 
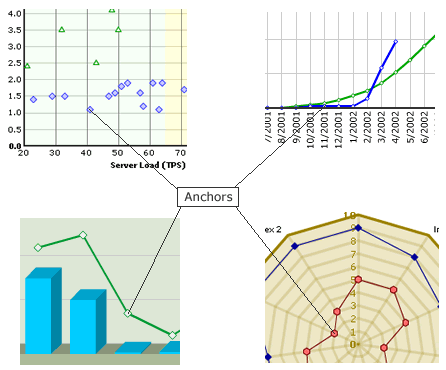
Line, Scatter, Radar Chart Anchors

You can define a lot of properties for the anchors like shape, radius, border color, thickness, alpha, background color, background alpha etc.
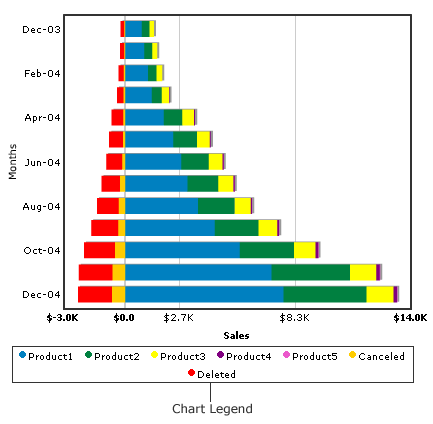
 
Multi-series chart Legend
And now that you are familiar with the various elements of the graph, let’s have a look at the XML attributes that control them.