Previously, we had seen how to use FusionCharts dynamically with client side scripts (JavaScript/VBScript). Here, we'll quickly run through a sample to see how we can put dynamic data from database, in conjunction with JavaScript, to create dynamic client side charts.
We'll quickly get into an example of creating a database driven chart utilizing the Northwind database. The Northwind database is the default database provided with MS SQL Server and MS Access. This database contains the sales data for a fictitious company called Northwind Traders, which imports and exports speciality foods from all around the world.
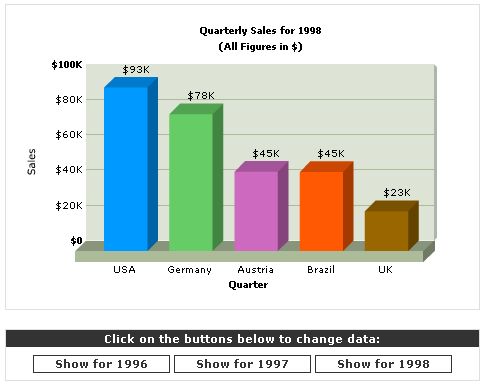
We'll plot a chart indicating the "Top 5 countries" for 3 years (1996, 1997, 1998). When the page loads up, we'll first show the data for 1998. However, there will be three buttons present in the page namely, "Show for 1996", "Show for 1997" and "Show for 1998", which when clicked would update the chart data dynamically at client side. We'll be using JavaScript to communicate from HTML page to FusionCharts, as JavaScript is compatible with a wide variety of browsers.
The finished application would look as under:

Getting to the database part of the application,
the pertinent data to be extracted is stored in a SQL Server View called
Invoices. First, we need to query this view
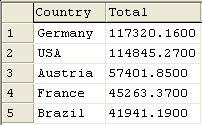
to get this data. To do so, we utilize the following SQL query:

Now, the job of our ASP page would be following:
- Retrieve the data "Top 5 Countries" for the 3 years
- Convert them into XML Data document
- Contain the JavaScript function setFCNewData
- Convey the XML data document stored in ASP variables to JavaScript variables.
- Embed the FusionCharts chart and initialize it with data for 1998
- Contain the three buttons, which when clicked would change the data.
We'll name the above page Chart.asp. We'll also have two other pages:
- Includes/Connection_inc.asp - This page contains the database connection string.
- Includes/FC_Colors.asp - This page contains a list of hex colors in the array arr_FCColors
The entire code of Chart.asp can be listed as under:
<!-- #INCLUDE FILE="Includes/Connection_inc.asp" -->
<!-- #INCLUDE FILE="Includes/FC_Colors.asp" -->
<%
'Define variables to store SQL query and the recordset object.
Dim strSQL, oRs
'Variables to store the top 5 countries data for 3 years
Dim strXML1996, strXML1997, strXML1998
'Initialize the recordset object
Set oRs = Server.CreateObject("ADODB.Recordset")
'--------------------XML Data for 1996 -------------------------
'Query the database
strSQL = "SELECT TOP 5 Country, SUM(ExtendedPrice) As Total, COUNT(DISTINCT OrderID) As orderNumber FROM Invoices WHERE YEAR(OrderDate)=1996 GROUP BY Country ORDER BY SUM(ExtendedPrice) DESC"
oRs.Open strSQL, DB_CONNECTION
'Create the <graph> element
strXML1996 = "<graph xaxisname='Quarter' yaxisname='Sales' caption='Quarterly Sales for 1996' subCaption='(All Figures in $)' numberPrefix='$' decimalPrecision='0'>"
'Now iterate through each data row
intCounter=0
While not oRs.EOF
'Increase the count
intCounter=intCounter+1
'Append the value in format <set name='...' value='...' color='...' />
strXML1996 = strXML1996 & "<set name='" & ors("Country") & "' value='" & ors("Total") & "' color='" & arr_FCColors(intCounter mod intFCColors_count) & "'/>"
oRs.MoveNext()
Wend
'Entire XML - concatenation
strXML1996 = strXML1996 & "</graph>"
oRs.Close()
'--------------------XML Data for 1997 -------------------------
'Query the database
strSQL = "SELECT TOP 5 Country, SUM(ExtendedPrice) As Total, COUNT(DISTINCT OrderID) As orderNumber FROM Invoices WHERE YEAR(OrderDate)=1997 GROUP BY Country ORDER BY SUM(ExtendedPrice) DESC"
oRs.Open strSQL, DB_CONNECTION
'Create the <graph> element
strXML1997 = "<graph xaxisname='Quarter' yaxisname='Sales' caption='Quarterly Sales for 1997' subCaption='(All Figures in $)' numberPrefix='$' decimalPrecision='0'>"
'Now iterate through each data row
intCounter=0
While not oRs.EOF
'Increase the count
intCounter=intCounter+1
'Append the value in format <set name='...' value='...' color='...' />
strXML1997 = strXML1997 & "<set name='" & ors("Country") & "' value='" & ors("Total") & "' color='" & arr_FCColors(intCounter mod intFCColors_count) & "'/>"
oRs.MoveNext()
Wend
'Entire XML - concatenation
strXML1997 = strXML1997 & "</graph>"
oRs.Close()
'--------------------XML Data for 1998 -------------------------
'Query the database
strSQL = "SELECT TOP 5 Country, SUM(ExtendedPrice) As Total, COUNT(DISTINCT OrderID) As orderNumber FROM Invoices WHERE YEAR(OrderDate)=1998 GROUP BY Country ORDER BY SUM(ExtendedPrice) DESC"
oRs.Open strSQL, DB_CONNECTION
'Create the <graph> element
strXML1998 = "<graph xaxisname='Quarter' yaxisname='Sales' caption='Quarterly Sales for 1998' subCaption='(All Figures in $)' numberPrefix='$' decimalPrecision='0'>"
'Now iterate through each data row
intCounter=0
While not oRs.EOF
'Increase the count
intCounter=intCounter+1
'Append the value in format <set name='...' value='...' color='...' />
strXML1998 = strXML1998 & "<set name='" & ors("Country") & "' value='" & ors("Total") & "' color='" & arr_FCColors(intCounter mod intFCColors_count) & "'/>"
oRs.MoveNext()
Wend
'Entire XML - concatenation
strXML1998 = strXML1998 & "</graph>"
oRs.Close()
%>
<HTML>
<HEAD>
<TITLE>FusionCharts Lite Demo Chart using dataURL method in ASP/MS SQL Northwind Database</TITLE>
<SCRIPT LANGUAGE="JavaScript">
<!--
//Create 3 variables to store the XML data for 3 years
var strXML1996, strXML1997, strXML1998;
strXML1996 = "<%=strXML1996%>";
strXML1997 = "<%=strXML1997%>";
strXML1998 = "<%=strXML1998%>";
function setFCNewData(objFlash, strXML) {
//This function updates the data of a FusionCharts present on the page
//Get a reference to the movie
var FCObject = getObject(objFlash);
//Set the data
//Set dataURL to null
FCObject.SetVariable('_root.dataURL',"");
//Set the flag
FCObject.SetVariable('_root.isNewData',"1");
//Set the actual data
FCObject.SetVariable('_root.newData',strXML);
//Go to the required frame
FCObject.TGotoLabel('/', 'JavaScriptHandler');
}
function getObject(objectName) {
if (navigator.appName.indexOf ("Microsoft") !=-1) {
return window[objectName]
} else {
return document[objectName]
}
}
//-->
</SCRIPT>
</HEAD>
...HTML Code...
<OBJECT classid="clsid:D27CDB6E-AE6D-11cf-96B8-444553540000"
codebase="http://download.macromedia.com/pub/shockwave/cabs/
flash/swflash.cab#version=6,0,0,0"
WIDTH="450" HEIGHT="300" id="FusionCharts_1"
ALIGN="">
<PARAM NAME=movie VALUE="../../Charts/FC_2_3_Column3D.swf">
<PARAM NAME=FlashVars VALUE="&chartWidth=450&chartHeight=300&dataXML=<%=
strXML1998%>">
<PARAM NAME=quality VALUE=high>
<PARAM NAME=bgcolor VALUE=#FFFFFF>
<EMBED src="../../Charts/FC_2_3_Column3D.swf" FlashVars="&chartWidth=450&chartHeight=300&dataXML=<%=
strXML1998 %>" quality=high bgcolor=#FFFFFF WIDTH="450"
HEIGHT="300" NAME="FusionCharts_1" ALIGN=""
TYPE="application/x-shockwave-flash" PLUGINSPAGE="http://www.macromedia.com/go/getflashplayer"></EMBED>
</OBJECT>
...HTML Code...
<INPUT TYPE='button' class='button' value='Show for 1996' onClick="javaScript:setFCNewData('FusionCharts_1',
strXML1996);" id='button'1 name='button'1>
<INPUT TYPE='button' class='button' value='Show for 1997' onClick="javaScript:setFCNewData('FusionCharts_1',
strXML1997);" id='button'1 name='button'1>
<INPUT TYPE='button' class='button' value='Show for 1998' onClick="javaScript:setFCNewData('FusionCharts_1',
strXML1998);" id='button'1 name='button'1>
...HTML Code...
<%
'Destroy objects
Set oRs = nothing
Set oRsYears = nothing
%>
In the above code, we're first retrieving the data for 3 years from the database, converting it into XML and storing them in our ASP variables strXML1996, strXML1997 and strXML1998.
Next, we initialize the chart with data for 1998.
codebase="http://download.macromedia.com/pub/shockwave/cabs/
flash/swflash.cab#version=6,0,0,0"
WIDTH="450" HEIGHT="300" id="FusionCharts_1" ALIGN="">
<PARAM NAME=movie VALUE="../../Charts/FC_2_3_Column3D.swf">
<PARAM NAME=FlashVars VALUE="&chartWidth=450&chartHeight=300&dataXML=<%= strXML1998%>">
<PARAM NAME=quality VALUE=high>
<PARAM NAME=bgcolor VALUE=#FFFFFF>
<EMBED src="../../Charts/FC_2_3_Column3D.swf" FlashVars="&chartWidth=450&chartHeight=300&dataXML=<%= strXML1998 %>" quality=high bgcolor=#FFFFFF WIDTH="450" HEIGHT="300" NAME="FusionCharts_1" ALIGN=""
TYPE="application/x-shockwave-flash" PLUGINSPAGE="http://www.macromedia.com/go/getflashplayer"></EMBED>
</OBJECT>
So, when the page loads, FusionCharts displays this data.
Next, we've initialized three variables in our JavaScript code snippet namely, strXML1996, strXML1997 and strXML1998. Each of these variable takes the XML data for a particular year from the ASP script. We've also embedded setFCNewData JavaScript function and the associate function getObject.
<!--
//Create 3 variables to store the XML data for 3 years
var strXML1996, strXML1997, strXML1998;
strXML1996 = "<%=strXML1996%>";
strXML1997 = "<%=strXML1997%>";
strXML1998 = "<%=strXML1998%>";
function setFCNewData(objFlash, strXML) { ... }
Towards the end, we define the three buttons namely, "Show for 1996", "Show for 1997" and "Show for 1998". Also, the onClick event handlers for each of the buttons has been defined (as under):
<INPUT TYPE='button' class='button' value='Show for 1997' onClick="javaScript:setFCNewData('FusionCharts_1', strXML1997);">
<INPUT TYPE='button' class='button' value='Show for 1998' onClick="javaScript:setFCNewData('FusionCharts_1', strXML1998);">
So, when the user clicks on any of the button, setFCNewData JavaScript function is invoked. To this function, we pass the id/name of the FusionCharts chart object (FusionCharts_1 in this case) as a string. We also pass a reference of the JavaScript variable which holds the XML data to show i.e., for the 1996 button, we pass the reference of strXML1996 variable, as it contains the XML data for the year 1996.
So, when you view the .asp page now, it would exactly like what we had seen earlier.