FusionCharts is a Macromedia Flash™ object, which has been coded closely in integration with VBScript. It exposes a set of methods that lets VBScript update its data.
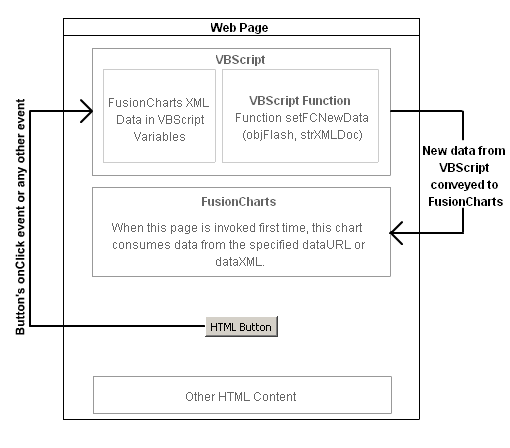
The entire process of VBScript to FusionCharts communication can be explained using the diagram below:

As you can see above, the web page consists of the following elements:
- FusionCharts chart object- This chart is the one which would be controlled by VBScript. Initially (i.e., for the first time), this chart would consume data from a dataURL or XML data provided via dataXML method. But, when the required action is invoked on the HTML page, this chart will communicate with VBScript to get the updated data.
- VBScript function to update the chart- The VBScript function setFCNewData would be responsible for updating FusionCharts with the new data. This function should be invoked when you wish to update the chart (say, on the click of a button etc.).
- The event invoker e.g., an HTML button or a link, on whose click, the VBScript function setFCNewData will be executed and FusionCharts chart would be updated.
Let's quickly see the code for the VBScript function setFCNewData. It can be listed as under:
'This function updates the chart
'Set dataURL to null
Call document.getElementById(objFlash).setVariable("_root.dataURL","")
'Set the flag
Call document.getElementById(objFlash).setVariable("_root.isNewData","1")
'Set the actual data
Call document.getElementById(objFlash).setVariable("_root.newData",strXML)
'Go to the required frame
Call document.getElementById(objFlash).TGotoLabel("/", "JavaScriptHandler")
End Function
In the above code setFCNewData function takes in two parameters:
- objFlash- Id/Name of the FusionCharts Flash object present
in the HTML page - When you embed a FusionCharts chart in your
HTML code, you always provide an id/name for it, as in the code below.
This parameter represents the Id/Name of that object.
<OBJECT classid="clsid:D27CDB6E-AE6D-11cf-96B8-444553540000"
codebase="http://download.macromedia.com/pub/shockwave/cabs/
flash/swflash.cab#version=6,0,0,0"
WIDTH="550" HEIGHT="400" id="FusionCharts_1" ALIGN="">
....
<EMBED ... WIDTH="550" HEIGHT="400" NAME="FusionCharts_1"
TYPE="application/x-shockwave-flash" PLUGINSPAGE="http://www.macromedia.com/go/getflashplayer">
</EMBED>
</OBJECT> - New XML data document as a string - strXML parameter accepts a string value which represents the new XML data document (the updated data which you want to reflect on the chart)
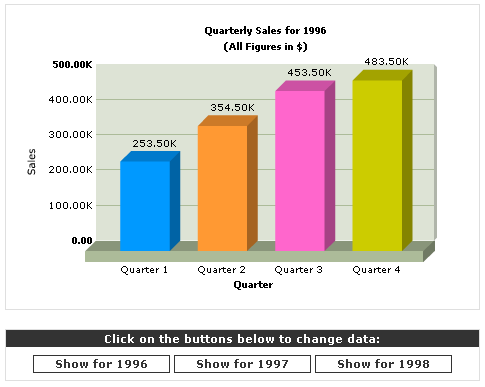
Let's now implement this VBScript in an HTML page to see a full fledged solution. We'll create a small single series 3D column chart depicting the "Quarterly Sales Summary". Initially, when the page is loaded, the chart will show the data for year 1998. Then, we would place three buttons in the same HTML page, namely "Show for 1996", "Show for 1997" and "Show for 1998". We'll also define event handlers for these three buttons and link them to the above VBScript code, so that when the end viewer clicks on the buttons, the chart would dynamically update itself. The end interface would look something as under:

<HTML>
<HEAD>
<TITLE>FusionCharts Client Side Dynamic Chart</TITLE>
<LINK REL=stylesheet HREF="Style.css" />
<script language="VBScript">
<!-- VBScript
'Create 3 variables to store the XML data for
3 years
Dim strXML1996, strXML1997, strXML1998
'Set the XML data for each one of them
strXML1996 = "<graph xaxisname='Quarter' yaxisname='Sales' caption='Quarterly
Sales for 1996' subCaption='(All Figures in $)' numberPrefix='$' decimalPrecision='0'>
<set name='Quarter 1' value='253500' color='0099FF'/> <set name='Quarter
2' value='354500' color='FF9933'/> <set name='Quarter 3' value='453500'
color='FF66CC'/> <set name='Quarter 4' value='483500' color='CCCC00'/></graph>"
strXML1997 = "<graph xaxisname='Quarter' yaxisname='Sales' caption='Quarterly
Sales for 1997' subCaption='(All Figures in $)' numberPrefix='$' decimalPrecision='0'>
<set name='Quarter 1' value='253500' color='0099FF'/> <set name='Quarter
2' value='454500' color='FF9933'/> <set name='Quarter 3' value='412500'
color='FF66CC'/> <set name='Quarter 4' value='483500' color='CCCC00'/></graph>"
strXML1998 = "<graph xaxisname='Quarter' yaxisname='Sales' caption='Quarterly
Sales for 1998' subCaption='(All Figures in $)' numberPrefix='$' decimalPrecision='0'>
<set name='Quarter 1' value='353500' color='0099FF'/> <set name='Quarter
2' value='354500' color='FF9933'/> <set name='Quarter 3' value='512500'
color='FF66CC'/> <set name='Quarter 4' value='583500' color='CCCC00'/></graph>"
Sub btn1996_onClick()
'Set data for 1996
Call setFCNewData("FusionCharts_1",strXML1996)
End Sub
Sub btn1997_onClick()
'Set data for 1997
Call setFCNewData("FusionCharts_1",strXML1997)
End Sub
Sub btn1998_onClick()
'Set data for 1998
Call setFCNewData("FusionCharts_1",strXML1998)
End Sub
Function setFCNewData(objFlash, strXML)
'This function updates the
chart
'Set dataURL to null
Call document.getElementById(objFlash).setVariable("_root.dataURL","")
'Set the flag
Call document.getElementById(objFlash).setVariable("_root.isNewData","1")
'Set the actual data
Call document.getElementById(objFlash).setVariable("_root.newData",strXML)
'Go to the required frame
Call document.getElementById(objFlash).TGotoLabel("/",
"JavaScriptHandler")
End Function
-->
</SCRIPT>
</HEAD>
<BODY bgcolor="#FFFFFF">
...HTML Code...
<OBJECT classid="clsid:D27CDB6E-AE6D-11cf-96B8-444553540000"
codebase="http://download.macromedia.com/pub/shockwave/cabs/
flash/swflash.cab#version=6,0,0,0"
WIDTH="450" HEIGHT="300" id="FusionCharts_1"
ALIGN="">
<PARAM NAME=movie VALUE="../../Charts/FC_2_3_Column3D.swf">
<PARAM NAME=FlashVars VALUE="&chartWidth=450&chartHeight=300&dataXML=<graph
xaxisname='Quarter' yaxisname='Sales' caption='Quarterly Sales for 1997'
subCaption='(All Figures in $)' numberPrefix='$' decimalPrecision='0'>
<set name='Quarter 1' value='353500' color='0099FF'/> <set name='Quarter
2' value='354500' color='FF9933'/> <set name='Quarter 3' value='512500'
color='FF66CC'/> <set name='Quarter 4' value='583500' color='CCCC00'/></graph>">
<PARAM NAME=quality VALUE=high>
<PARAM NAME=bgcolor VALUE=#FFFFFF>
<EMBED src="../../Charts/FC_2_3_Column3D.swf" FlashVars="&chartWidth=450&chartHeight=300&dataXML=<graph
xaxisname='Quarter' yaxisname='Sales' caption='Quarterly Sales for 1997'
subCaption='(All Figures in $)' numberPrefix='$' decimalPrecision='0'>
<set name='Quarter 1' value='353500' color='0099FF'/> <set name='Quarter
2' value='354500' color='FF9933'/> <set name='Quarter 3' value='512500'
color='FF66CC'/> <set name='Quarter 4' value='583500' color='CCCC00'/></graph>"
quality=high bgcolor=#FFFFFF WIDTH="450" HEIGHT="300"
NAME="FusionCharts_1" ALIGN=""
TYPE="application/x-shockwave-flash" PLUGINSPAGE="http://www.macromedia.com/go/getflashplayer"></EMBED>
</OBJECT>
...HTML Code...
Click on the buttons below to change data:
...HTML Code...
<INPUT TYPE='button' class='button' value='Show for 1996' name='btn1996'
id='btn1996'>
<INPUT TYPE='button' class='button' value='Show for 1997' name='btn1997'
id='btn1997'>
<INPUT TYPE='button' class='button' value='Show for 1998' name='btn1998'
id='btn1998'>
...HTML Code...
</BODY>
</HTML>
<PARAM NAME=movie VALUE="../../Charts/FC_2_3_Column3D.swf">
<PARAM NAME=FlashVars VALUE="&chartWidth=450&chartHeight=300&dataXML=<graph ... >...</graph>">
....
<EMBED src="../../Charts/FC_2_3_Column3D.swf" FlashVars="&chartWidth=450&chartHeight=300&dataXML=<graph ... >...</graph>" quality=high ... NAME="FusionCharts_1" ></EMBED>
</OBJECT>
So, when the page loads, FusionCharts displays this data.
Next, we've initialized three variables in our VBScript code snippet namely, strXML1996, strXML1997 and strXML1998. Each of these variable stores the XML data for a particular year.
Dim strXML1996, strXML1997, strXML1998
'Set the XML data for each one of them
strXML1996 = "<graph xaxisname='Quarter' yaxisname='Sales' caption='Quarterly Sales for 1996' subCaption='(All Figures in $)' numberPrefix='$' decimalPrecision='0'> <set name='Quarter 1' value='253500' color='0099FF'/> <set name='Quarter 2' value='354500' color='FF9933'/> <set name='Quarter 3' value='453500' color='FF66CC'/> <set name='Quarter 4' value='483500' color='CCCC00'/></graph>"
strXML1997 = "<graph xaxisname='Quarter' yaxisname='Sales' caption='Quarterly Sales for 1997' subCaption='(All Figures in $)' numberPrefix='$' decimalPrecision='0'> <set name='Quarter 1' value='253500' color='0099FF'/> <set name='Quarter 2' value='454500' color='FF9933'/> <set name='Quarter 3' value='412500' color='FF66CC'/> <set name='Quarter 4' value='483500' color='CCCC00'/></graph>"
strXML1998 = "<graph xaxisname='Quarter' yaxisname='Sales' caption='Quarterly Sales for 1998' subCaption='(All Figures in $)' numberPrefix='$' decimalPrecision='0'> <set name='Quarter 1' value='353500' color='0099FF'/> <set name='Quarter 2' value='354500' color='FF9933'/> <set name='Quarter 3' value='512500' color='FF66CC'/> <set name='Quarter 4' value='583500' color='CCCC00'/></graph>"
Thereafter, we place our VBScript function setFCNewData.
Also, the onClick event handlers for each of the three buttons have been defined (as under):
Sub btn1996_onClick()
'Set data for 1996
Call setFCNewData("FusionCharts_1",strXML1996)
End Sub
Sub btn1997_onClick()
'Set data for 1997
Call setFCNewData("FusionCharts_1",strXML1997)
End Sub
Sub btn1998_onClick()
'Set data for 1998
Call setFCNewData("FusionCharts_1",strXML1998)
End Sub
<INPUT TYPE='button' class='button' value='Show for 1996' name='btn1996' id='btn1996'>
<INPUT TYPE='button' class='button' value='Show for 1997' name='btn1997' id='btn1997'>
<INPUT TYPE='button' class='button' value='Show for 1998' name='btn1998' id='btn1998'>
So, when the user clicks on any of the button, setFCNewData VBScript function is invoked. To this function, we pass the id/name of the FusionCharts chart object (FusionCharts_1 in this case) as a string. We also pass a reference of the VBScript variable which holds the XML data to show i.e., for the 1996 button, we pass the reference of strXML1996 variable, as it contains the XML data for the year 1996.
The end result looks as under (it's a live version below - click on any button to see the effect):
| Click on the buttons below to change data: |