To convert a chart type, all you need to do is change the .swf file that you're using. That is to say, if you're using a single series Column Chart, just changing the .swf file to Single Series Pie Chart would change the chart output to a pie, the data remaining the same (or with minor cosmetic changes).
Let's quickly see the changes we need to make.
<BODY bgcolor="#FFFFFF">
<OBJECT classid="clsid:D27CDB6E-AE6D-11cf-96B8-444553540000" codebase="http://download.macromedia.com/pub/shockwave/cabs/
flash/swflash.cab#version=6,0,0,0" WIDTH="565" HEIGHT="420" id="FusionCharts">
<PARAM NAME=movie VALUE="../Charts/FC_2_3_Pie3D.swf">
<PARAM NAME="FlashVars" VALUE="&dataURL=Data.xml">
<PARAM NAME=quality VALUE=high>
<PARAM NAME=bgcolor VALUE=#FFFFFF>
<EMBED src="../Charts/FC_2_3_Pie3D.swf" FlashVars="&dataURL=Data.xml" quality=high bgcolor=#FFFFFF WIDTH="565" HEIGHT="420" NAME="FusionCharts" TYPE="application/x-shockwave-flash" PLUGINSPAGE="http://www.macromedia.com/go/getflashplayer"></EMBED>
</OBJECT>
</BODY>
</HTML>
In the above code, we've just changed the name of FusionCharts .swf file from (Column Chart to Pie Chart i.e., FC_2_3_Column3D.swf to FC_2_3_Pie3D.swf).
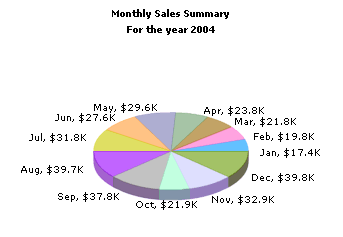
And now when you view MyFirstPieChart.html, in your browser, you'll see the following output:
So you just saw how easy it is to change the chart output type - merely change the .swf file (within the same series), make cosmetic changes in your XML data document and you're done.
We'll next see how to resize a FusionCharts chart as per our requirements.