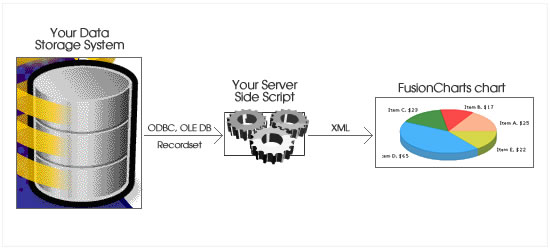
FusionCharts is meant for plotting dynamic data on the web. It can plot charts with data stored in any form of data storage system. Since, FusionCharts doesn't directly interact with your data storage system, it doesn't matter what form of data storage you're using. That means, regardless of which app server and database you pair it with, FusionCharts will always be able to create data-driven interactive charts.
Cruising through an example initially will make the picture much more clearer for you. Let's quickly get to it and see how the entire process can be put into action.
Say, we wanted to plot a chart indicating the Top 5 countries,
for a particular year. The pertinent data to be extracted is stored in
a SQL Server View called Invoices. First, we need to query this view to
get this data. To do so, we utilize the following SQL query:
<set name='Germany' value='117320.16' color='0099FF'/>
<set name='USA' value='114845.27' color='66CC66'/>
<set name='Austria' value='57401.85' color='CD6AC0'/>
<set name='France' value='45263.37' color='FF5904'/>
<set name='Brazil' value='41941.19' color='996600'/>
</graph>
(Initialize your page)
(Interact with database/other forms of storage and get the recordset).
Now, the retrieved data is present in object which can iterated sequentially.
Step 1: Initialize a variable say strFCXMLDoc - this
would be used to store the entire XML data document
Step 2: Define strFCXMLDoc to contain the document element
and it's attributes. E.g., strFCXMLDoc="<graph
... attributes here ... >"
Step 3: Start the iterator loop for the recordset (i.e.,
loop through the Recordset)
Step 4: Get the name and value data from the recordset
(something like strName=oRs("Name"),
intValue=oRs("Value))
Step 5: Get a hex color code for this row. To attain
this, you can store a list of hex colors in an external array. Thereby,
you can recall a color from array either randomly or sequentially using
a counter variable. If you wish to recall a color sequentially, you will
have to use a counter variable to keep a track of current row in the recordset,
say intCount. You can now access the color using something like strColor
= FCColors_array(intCount mod arraySize). This
would make sure that even if you've lesser colors stored in your array,
it would start iterating from the first color once the color list is over.
Step 5: Add the above extracted values to strFCXMLDoc
in the format <set name='...' value='...' color='...' />. The code
could be in the format: strFCXMLDoc =
strFCXMLDoc + "<set value='" + intValue + "' name='"
+ strName + "' color='" + strColor + "' />"
Step 6: End the iterator loop
Step 7: Finalize the XML data document by adding the
end </graph>
element. E.g., strFCXMLDoc = strFCXMLDoc
+ "</graph>"
(The XML document is now ready to be used. We'll next see how to use this
document.)
Now, that you've the XML data ready to be served, you need to know the ways to serve it to FusionCharts. FusionCharts can accept the XML data in two ways:
- dataXML method
- dataURL method
Both the above methods accept the same XML data document, but in different ways. Let's see each of them in detail.
dataXML method is used as under:
<HEAD>
...
</HEAD>
<BODY bgcolor="#FFFFFF">
... Other Content here ...
<!-- Chart Object starts here -->
<OBJECT classid="clsid:D27CDB6E-AE6D-11cf-96B8-444553540000"
codebase="http://download.macromedia.com/pub/shockwave/cabs/flash/swflash.cab#version=6,0,0,0"
WIDTH="565" HEIGHT="420" id="FC_2_3_Column3D" ALIGN="">
<PARAM NAME=FlashVars VALUE="&dataXML=<graph decimalPrecision='0' numberPrefix='$'> <set name='Germany' value='117320.16' color='0099FF'/> <set name='USA' value='114845.27' color='66CC66'/> <set name='Austria' value='57401.85' color='CD6AC0'/> <set name='France' value='45263.37' color='FF5904'/> <set name='Brazil' value='41941.19' color='996600'/> </graph>">
<PARAM NAME=movie VALUE="FC_2_3_Column3D.swf">
<PARAM NAME=quality VALUE=high>
<EMBED FlashVars="&dataXML=<graph decimalPrecision='0' numberPrefix='$'> <set name='Germany' value='117320.16' color='0099FF'/> <set name='USA' value='114845.27' color='66CC66'/> <set name='Austria' value='57401.85' color='CD6AC0'/> <set name='France' value='45263.37' color='FF5904'/> <set name='Brazil' value='41941.19' color='996600'/> </graph>" src="FC_2_3_Column3D.swf" quality=high WIDTH="565" HEIGHT="420" NAME="FC_2_3_Column3D" ALIGN=""
TYPE="application/x-shockwave-flash" PLUGINSPAGE="http://www.macromedia.com/go/getflashplayer"></EMBED>
</OBJECT>
<!-- Chart Object Ends here -->
... Other Content here ...
</BODY>
</HTML>
Note: The FlashVars must be passed in both Param tag (for Internet Explorer-based browsers) as well as the Embed tag (for Netscape/Mozilla-based browsers); any non-URL safe characters, such as spaces, must be replaced with a % sign followed by a two-digit hexadecimal value (like %20 in place of a space, %25 in place of a percentage or %26 in place of an ampersand).
Let's now quickly see how to mould your server side script to use FusionCharts
using the dataXML method.
Step 1:
Initialize your page
Step 2: Render other contents of the page
Step 3: Interact with database/other forms of storage
and get the recordset. Generate the XML document in the variable strFCXMLDoc
as earlier seen
Step 4: Output the HTML code for chart generation as
under.
<OBJECT classid="clsid:D27CDB6E-AE6D-11cf-96B8-444553540000"
codebase="http://download.macromedia.com/pub/shockwave/cabs/flash/swflash.cab#version=6,0,0,0"
WIDTH="565" HEIGHT="420" id="FC_2_3_Column3D" ALIGN="">
<PARAM NAME=FlashVars VALUE="&dataXML=<%=strFCXMLDoc%>">
<PARAM NAME=movie VALUE="FC_2_3_Column3D.swf">
<PARAM NAME=quality VALUE=high>
<EMBED FlashVars="&dataXML=<%=strFCXMLDoc%>" src="FC_2_3_Column3D.swf" quality=high WIDTH="565" HEIGHT="420" NAME="FC_2_3_Column3D" ALIGN=""
TYPE="application/x-shockwave-flash" PLUGINSPAGE="http://www.macromedia.com/go/getflashplayer"></EMBED>
</OBJECT>
Step 5: Render other contents of
the page
Step 6: End Page
- Chart Container Page - This page contains the chart object alongwith any other HTML objects. This page can be a static HTML page or a dynamic server side script too. Say, for instance, in the example above you wanted to give the user an option to see the "Top 5 Countries" chart for any year. Then, you would have to make this page a dynamic one, which could collect the year information from the user and pass it onto the chart alongwith the data provider URL.
- Data Provider Page - This page provides the XML data required by the chart. This page is invoked by FusionCharts (with any parameters that you might have supplied as querystring). In this page, you place your scripts to access and retrieve the required data from the database, encode it in XML and finally write it to the output stream.
- Chart.ext (e.g., Chart.asp, Chart.aspx, Chart.php...) - This page would contain the drop down box that lets the user select an year. Just below the drop down box would be the chart object. By default, the last year would remain as selected and the chart would show the data for same.
- Data.ext (e.g., Data.asp, Data.aspx, Data.php ...) - This page provides the XML data to chart, when requested.
Chart.ext can be coded under the following guidelines:
(Initialize your page)
(Interact with database/other forms of storage and get the list of years).
Present this list of years in a select box.
(Render other Content)
Step 1: Retrieve the selected year (or default year,
if the page is invoked for first time) and store it in intYear
variable.
Step 2: Define the dataURL for the chart in the format
Data.asp?Year=(intYear) - you'll also need to URL Encode it as:
strDataURL = URLEncodeFunction("Data.asp?Year="+intYear)
URL Encoding means converting the special characters present in a
string (like ?,&, space etc) into URL friendly format (that is a %
followed by the 2 digit hexadecimal value of the character). In all the
scripting languages, you've functions/class methods that you can use to
URL Encode a string.
Step 3: Write out the chart HTML code as below:
<OBJECT classid="clsid:D27CDB6E-AE6D-11cf-96B8-444553540000"
codebase="http://download.macromedia.com/pub/shockwave/cabs/flash/swflash.cab#version=6,0,0,0"
WIDTH="565" HEIGHT="420" id="FC_2_3_Column3D" ALIGN="">
<PARAM NAME=FlashVars VALUE="&dataURL=<%=strDataURL%>">
<PARAM NAME=movie VALUE="FC_2_3_Column3D.swf">
<PARAM NAME=quality VALUE=high>
<EMBED FlashVars="&dataXML=<%=strDataURL%>" src="FC_2_3_Column3D.swf" quality=high WIDTH="565" HEIGHT="420" NAME="FC_2_3_Column3D" ALIGN=""
TYPE="application/x-shockwave-flash" PLUGINSPAGE="http://www.macromedia.com/go/getflashplayer"></EMBED>
</OBJECT>
(Render other Content)
(Initialize your page)
Step 1: Request Year from the querystring and store it
in intYear.
Step 2: Initialize a variable say strFCXMLDoc
- this would be used to store the entire XML data document
Step 3: Interact with database/other forms of storage
and get the recordset. Now, the retrieved data is present in object which
can iterated sequentially.
Step 4: Define strFCXMLDoc to contain the document element
and it's attributes. E.g., strFCXMLDoc="<graph
... attributes here ... >"
Step 5: Start the iterator loop for the recordset (i.e.,
loop through the Recordset)
Step 6: Get the name and value data from the recordset
(something like strName=oRs("Name"),
intValue=oRs("Value))
Step 7: Get a hex color code for this row. To attain
this, you can store a list of hex colors in an external array. Thereby,
you can recall a color from array either randomly or sequentially using
a counter variable. If you wish to recall a color sequentially, you will
have to use a counter variable to keep a track of current row in the recordset,
say intCount. You can now access the color using something like strColor
= FCColors_array(intCount mod arraySize). This
would make sure that even if you've lesser colors stored in your array,
it would start iterating from the first color once the color list is over.
Step 8: Add the above extracted values to strFCXMLDoc
in the format <set name='...' value='...' color='...' />. The code
could be in the format: strFCXMLDoc =
strFCXMLDoc + "<set value='" + intValue + "' name='"
+ strName + "' color='" + strColor + "' />"
Step 9: End the iterator loop
Step 10: Finalize the XML data document by adding the
end </graph>
element. E.g., strFCXMLDoc = strFCXMLDoc
+ "</graph>"
Step 11: Write the XML document to output stream.
Make sure that in this page, you do not output anything apart from the XML document - that is no HTML content should be present in the document. And, the XML output should be a valid XML structure.
And, when you now see the chart, you'll get the required output.
Here, we've seen a very generalized and conceptual explanation of using FusionCharts with a database. The next few sections span into details of using FusionCharts with your server side script and database. Based on the server side script (ASP, ASP.NET, CF, PHP etc.) that you're using, you can directly jump to the pertinent section next.