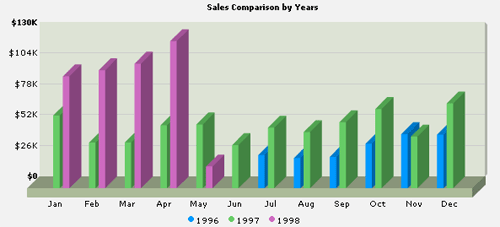
Clickable charts are most often used to produce charts that have “drill down” or “zoom in” capabilities. For example, a pie chart could be created such that when a user clicks on the sectors, the browser will load another web page containing a detailed chart regarding that sector. Similarly, a day-of-week bar chart could be created such that when a user clicks on a bar, the browser will load an hour-of-day chart for the day that the user has clicked.
FusionCharts can be used extensively to create clickable or drill-down charts charts. All the charts in the suite support drill down functionality.
To define a link on any FusionCharts chart, all you need to do is define
the link attribute for the <set> element
as under:
<set name='Jan' value='2235' link='ShowDetails.asp%3FMonth%3DJan'…>
The above data set (column, line, pie …) when clicked will take to a page ShowDetails.asp?Month=Jan, which might contain another chart to show detailed results for the month of January.
As you will note above, the link is URL Encoded (that is, converted into a URL friendly format). In simple text, the link above can be written as ShowDetails.asp?Month=Jan. However, if you give characters such as ? and & in XML, it would give errors. So, you need to URL Encode the entire link. All the server side scripting languages provide a generic function to URL Encode any string - like in ASP and ASP.NET, we've Server.URLEncode(strURL) and so on.
Quite often, you might want to open the drill-down link in a new window instead of opening in the same window. To have a link open in a new window, all you need to do is, add n- before any link. E.g.,
<set name='Jan' value='2235' link='n-ShowDetails.asp%3FMonth%3DJan'…>
The above link (be it for pie, column, bar etc..) when clicked, will open the page ShowDetails.asp?Month=Jan in a new window, instead of the same window.
<categories>
<category name='Jan' />
<category name='Feb' />
<category name='Mar' />
<category name='Apr' />
<category name='May' />
<category name='Jun' />
<category name='Jul' />
<category name='Aug' />
<category name='Sep' />
<category name='Oct' />
<category name='Nov' />
<category name='Dec' />
</categories>
<dataset anchorSides='3' seriesName='1996' color='0099FF' anchorBorderColor='0099FF'>
<set />
<set />
<set />
<set />
<set />
<set />
<set value='27861.9' alpha='100' link='n-SalesComparisonDrill.asp%3FYear=1996%3DMonth=7'/>
<set value='25485.28' alpha='100' link='n-SalesComparisonDrill.asp%3FYear=1996%3DMonth=8'/>
<set value='26381.4' alpha='100' link='n-SalesComparisonDrill.asp%3FYear=1996%3DMonth=9'/>
<set value='37515.73' alpha='100' link='n-SalesComparisonDrill.asp%3FYear=1996%3DMonth=10'/>
<set value='45600.04' alpha='100' link='n-SalesComparisonDrill.asp%3FYear=1996%3DMonth=11'/>
<set value='45239.63' alpha='100' link='n-SalesComparisonDrill.asp%3FYear=1996%3DMonth=12'/>
</dataset>
<dataset anchorSides='4' seriesName='1997' color='66CC66' anchorBorderColor='66CC66'>
<set value='61258.07' alpha='100' link='n-SalesComparisonDrill.asp%3FYear=1997%3DMonth=1'/>
<set value='38483.64' alpha='100' link='n-SalesComparisonDrill.asp%3FYear=1997%3DMonth=2'/>
<set value='38547.23' alpha='100' link='n-SalesComparisonDrill.asp%3FYear=1997%3DMonth=3'/>
<set value='53032.95' alpha='100' link='n-SalesComparisonDrill.asp%3FYear=1997%3DMonth=4'/>
<set value='53781.29' alpha='100' link='n-SalesComparisonDrill.asp%3FYear=1997%3DMonth=5'/>
<set value='36362.79' alpha='100' link='n-SalesComparisonDrill.asp%3FYear=1997%3DMonth=6'/>
<set value='51020.87' alpha='100' link='n-SalesComparisonDrill.asp%3FYear=1997%3DMonth=7'/>
<set value='47287.68' alpha='100' link='n-SalesComparisonDrill.asp%3FYear=1997%3DMonth=8'/>
<set value='55629.23' alpha='100' link='n-SalesComparisonDrill.asp%3FYear=1997%3DMonth=9'/>
<set value='66749.24' alpha='100' link='n-SalesComparisonDrill.asp%3FYear=1997%3DMonth=10'/>
<set value='43533.79' alpha='100' link='n-SalesComparisonDrill.asp%3FYear=1997%3DMonth=11'/>
<set value='71398.42' alpha='100' link='n-SalesComparisonDrill.asp%3FYear=1997%3DMonth=12'/>
</dataset>
<dataset anchorSides='5' seriesName='1998' color='CD6AC0' anchorBorderColor='CD6AC0'>
<set value='94222.11' alpha='100' link='n-SalesComparisonDrill.asp%3FYear=1998%3DMonth=1'/>
<set value='99415.28' alpha='100' link='n-SalesComparisonDrill.asp%3FYear=1998%3DMonth=2'/>
<set value='104854.17' alpha='100' link='n-SalesComparisonDrill.asp%3FYear=1998%3DMonth=3'/>
<set value='123798.69' alpha='100' link='n-SalesComparisonDrill.asp%3FYear=1998%3DMonth=4'/>
<set value='18333.63' alpha='100' link='n-SalesComparisonDrill.asp%3FYear=1998%3DMonth=5'/>
<set />
<set />
<set />
<set />
<set />
<set />
<set />
</dataset>
</graph>

Each of the column in the above chart is clickable and each link opens in a new window pointing to SalesComparisonDrill.asp?Year=199x&Month=xx. A different month and year is associated with each column i.e., each column in the chart represents a particular month and year - and when that column is clicked, detailed charts/data tables for that particular month and year show up.
So you just saw how easy it is to create drill-down charts using FusionCharts.