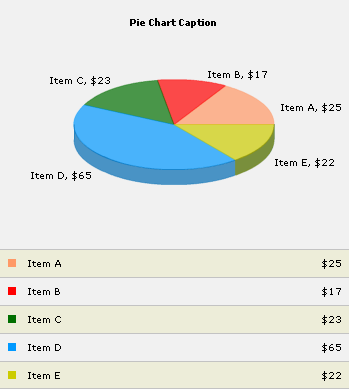
As you can see, there are two FusionCharts element in the above output:
- The 3D Pie chart
- The Single Series Grid Component
The Single Series Grid component acts like any other FusionCharts chart in the sense, that it can be resized like any other chart, it reads the XML data which the chart reads.
Let's quickly see the HTML code that was used to create the above result:
<HTML>
<HEAD>
<TITLE>FusionCharts</TITLE>
</HEAD>
<BODY bgcolor="#FFFFFF">
<OBJECT classid="clsid:D27CDB6E-AE6D-11cf-96B8-444553540000"
codebase="http://download.macromedia.com/pub/shockwave/cabs/
flash/swflash.cab#version=6,0,0,0"
WIDTH="350" HEIGHT="250" id="FCPie" ALIGN="">
<PARAM NAME=movie VALUE="../Charts/FC_2_3_Pie3D.swf?dataURL=data.xml&chartHeight=250">
<PARAM NAME=quality VALUE=high> <PARAM NAME=bgcolor VALUE=#FFFFFF>
<EMBED src="../Charts/FC_2_3_Pie3D.swf?dataURL=data.xml&chartHeight=250"
quality=high bgcolor=#FFFFFF WIDTH="350" HEIGHT="250"
NAME="FCPie" ALIGN=""
TYPE="application/x-shockwave-flash" PLUGINSPAGE="http://www.macromedia.com/go/getflashplayer"></EMBED>
</OBJECT>
<BR>
<OBJECT classid="clsid:D27CDB6E-AE6D-11cf-96B8-444553540000"
codebase="http://download.macromedia.com/pub/shockwave/cabs/
flash/swflash.cab#version=6,0,0,0"
WIDTH="350" HEIGHT="140" id="FCGrid" ALIGN="">
<PARAM NAME=movie VALUE="../Charts/FC_2_3_SSGrid.swf?dataURL=data.xml&chartHeight=140&chartWidth=350">
<PARAM NAME='FlashVars' VALUE='&alternateRowBgColor=CCCC00&alternateRowBgAlpha=10'
>
<PARAM NAME=quality VALUE=high> <PARAM NAME=bgcolor VALUE=#FFFFFF>
<EMBED src="../Charts/FC_2_3_SSGrid.swf?dataURL=data.xml&chartHeight=140&chartWidth=350"
FlashVars='&alternateRowBgColor=CCCC00&alternateRowBgAlpha=10'
quality=high bgcolor=#FFFFFF WIDTH="350" HEIGHT="140"
NAME="FCGrid" ALIGN=""
TYPE="application/x-shockwave-flash" PLUGINSPAGE="http://www.macromedia.com/go/getflashplayer"></EMBED>
</OBJECT>
</BODY>
</HTML>
In the above code, the first <OBJECT></OBJECT> tags have been used to embed the 3D Pie chart. The pie chart consumes data from Data.xml.
The second block of <OBJECT></OBJECT> tags have been used to embed the grid component. This grid takes data from the same Data.xml, which the pie chart is using, thereby letting you reuse the data. Like any other chart in the FusionCharts suite, the grid component can take data using both methods:
- dataURL method
- dataXML method
Moreover, we've resized the grid as we would resize any other chart, using:
<PARAM NAME=movie VALUE="../Charts/FC_2_3_SSGrid.swf?dataURL=data.xml&chartHeight=140&chartWidth=350">
Next, we've provided a few more attributes using the FlashVars method to this grid component. The grid component can take a lot of attributes (which we'll see next), and these attributes control the visual and functional look of the grid.
<PARAM NAME='FlashVars' VALUE='&alternateRowBgColor=CCCC00&alternateRowBgAlpha=10'
>
.......
<EMBED .... FlashVars='&alternateRowBgColor=CCCC00&alternateRowBgAlpha=10'
..>
Let's quickly see these additional attributes in the next section.