In our previous example we had seen how to load a FusionCharts chart inside our Flash movie as soon as the base movie is loaded. However, in practical scenarios, you might not always want to show the chart as soon as your movie/application is loaded. Charts need to be shown on a certain event (like when the user enters the data and then clicks a button etc). Here, we'll see a very basic example of how to carry out event based loading of FusionCharts charts.
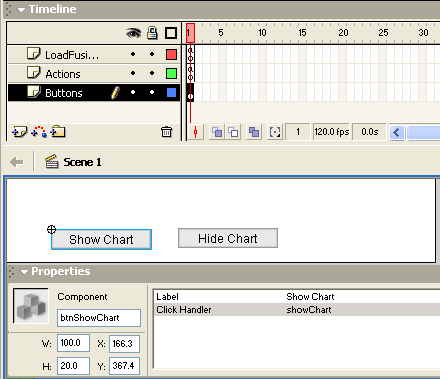
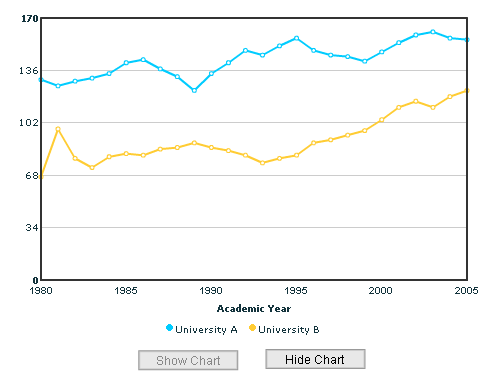
We'll replicate the previous chart "International Students" and render it in an event based environment. We'll be creating two buttons namely "Show Chart" and "Hide Chart". Only when the user clicks the "Show Chart" button, we'll load the chart. And upon clicking the "Hide Chart", we'll unload the chart from our Flash movie.

createEmptyMovieClip("FusionChartsHolder", 100);
//By default set the hide button disabled
btnHideChart.setEnabled(false);
//Local function - this would act as the click handler for the show button
function showChart() {
//Load the chart
FusionChartsHolder.loadFusionCharts("FC_2_3_MSLine.swf", 101, "Data.xml", null, 500, 350, 25, 20);
//Alter the button states
btnShowChart.setEnabled(false);
btnHideChart.setEnabled(true);
}
//Local function - this would act as the click handler for the hide button
function hideChart() {
FusionChartsHolder.unloadMovie();
//Alter the button states
btnShowChart.setEnabled(true);
btnHideChart.setEnabled(false);
}
//Stop here
stop();
In the above code, we do the following:
- We create an empty movie clip and name it as FusionChartsHolder. This movie clip would load the FusionCharts chart.
- Disable the hide chart button (as there is nothing to hide as of now!)
- Create the showChart function. In this function, we simply load the multi-series line chart at a depth of 101, with a size of 500x350 pixels at (25,20). We also interchange the states of the show and hide button.
- Create the hideChart function, which unloads the currently loaded FusionCharts chart, and alters the button state.
And when you now see this movie, you'll see something as under:

In all our previous examples, we've seen how to load a single chart into a frame. However, you can load more than one chart in your movie - they just need to be in a sequence - that is the second chart should be initiated only after the first chart is complete. We'll now simulate this example using event handlers.
We'll replicate our previous chart to do the following:
- By default, when the movie is played, there would be our multi-series line chart depicting the trend of "International Students".
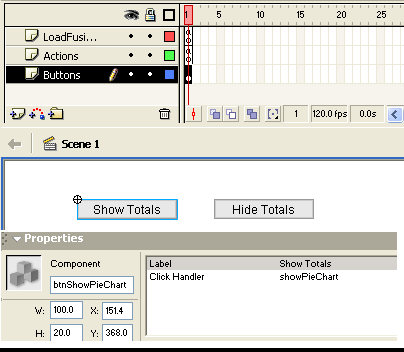
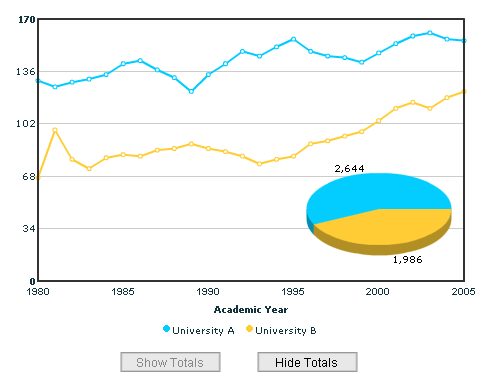
- Now, the Show Chart and Hide Chart buttons would be replaced by Show Total and Hide Total buttons. These buttons (the new ones), when clicked would show and hide a small pie chart over the existing line chart. The pie chart would represent the total figures for both the Universities - A & B.
To start with, we first create a new folder FCLoad>EventBasedMultipleCharts to contain the new elements. We now create a new movie BaseMovie.fla and again set its fps as 120. We also place a copy of the 3D Pie Chart (.swf) in this folder. Next, we copy our old Data.xml into this folder and rename it as Data_Line.xml. We also create a new XML data document and name it as Data_pie.xml. Data_Pie.xml contains the following:
<set value='2644' name='University A' color='00ccff' />
<set value='1986' name='University B' color='ffcc33' />
</graph>

createEmptyMovieClip("FusionChartsLineHolder", 100);
createEmptyMovieClip("FusionChartsPieHolder", 400);
//Load the line chart
FusionChartsLineHolder.loadFusionCharts("FC_2_3_MSLine.swf", 101, "Data_Line.xml", null, 500, 350, 25, 20);
//By default set the hide button disabled
btnHidePieChart.setEnabled(false);
//Local function - this would act as the click handler for the pie show button
function showPieChart() {
//Load the chart
FusionChartsPieHolder.loadFusionCharts("FC_2_3_Pie3D.swf", 401, "Data_Pie.xml", null, 200, 200, 310, 130);
//Alter the button states
btnShowPieChart.setEnabled(false);
btnHidePieChart.setEnabled(true);
}
//Local function - this would act as the click handler for the hide button
function hidePieChart() {
FusionChartsPieHolder.unloadMovie();
//Alter the button states
btnShowPieChart.setEnabled(true);
btnHidePieChart.setEnabled(false);
}
//Stop here
stop();
In the above code, we first load the multi-series line chart by default. Thereafter, we load the pie chart only when the show totals button is clicked. And, when the hide totals button is clicked, we hide the pie chart too.
One thing noticeable here is that we've used separate depths for the multi-series line chart and the pie chart. The line chart consumes lower depth from 100 ,101.. and the pie chart is placed at a depth of 400,401.. so that it appears over the line chart.
When you view this movie, you'll get the following output:
