Often in our web pages, we've a constrained space for the chart demanding us to either increase or decrease the size of the chart. Here, we'll see how to resize a FusionCharts chart.
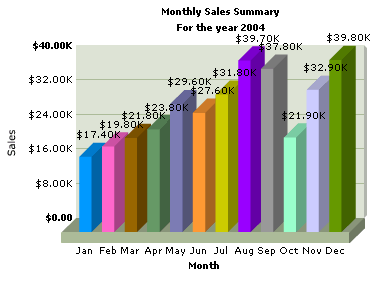
We'll take our previous Column (Monthly sales summary) Chart example and see how it can be resized.
<BODY bgcolor="#FFFFFF">
<OBJECT classid="clsid:D27CDB6E-AE6D-11cf-96B8-444553540000" codebase="http://download.macromedia.com/pub/shockwave/cabs/
flash/swflash.cab#version=6,0,0,0" WIDTH="400" HEIGHT="300" id="FC_2_3_Column3D">
<PARAM NAME=movie VALUE="../Charts/FC_2_3_Column3D.swf">
<PARAM NAME="FlashVars" VALUE="&dataURL=Data.xml&chartWidth=400&chartHeight=300">
<PARAM NAME=quality VALUE=high>
<PARAM NAME=bgcolor VALUE=#FFFFFF>
<EMBED src="../Charts/FC_2_3_Column3D.swf" FlashVars="&dataURL=Data.xml&chartWidth=400&chartHeight=300" quality=high bgcolor=#FFFFFF WIDTH="400" HEIGHT="300" NAME="FC_2_3_Column3D" TYPE="application/x-shockwave-flash" PLUGINSPAGE="http://www.macromedia.com/go/getflashplayer"></EMBED>
</OBJECT>
</BODY>
</HTML>
All in all, we need to change the width and height at 4 places:
- In the width and height properties of the <OBJECT> Tag
- In the width and height properties of the <EMBED> Tag
- We also introduce two new parameters under the FlashVars parameter of OBJECT Tag- chartWidth and chartHeight.
- The above two parameters also get introduced in the FlashVars parameter of EMBED Tag
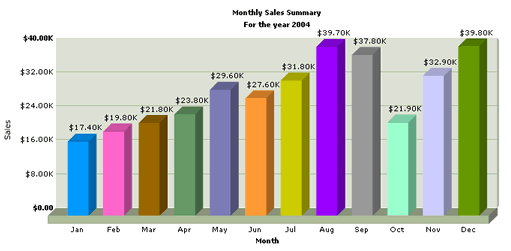
This would be all - when you now view the HTML page, the chart is all resized with all the elements of the chart being proportionately resized. Shown below is the output for above:

<BODY bgcolor="#FFFFFF">
<OBJECT classid="clsid:D27CDB6E-AE6D-11cf-96B8-444553540000" codebase="http://download.macromedia.com/pub/shockwave/cabs/
flash/swflash.cab#version=6,0,0,0" WIDTH="700" HEIGHT="350" id="FC_2_3_Column3D">
<PARAM NAME=movie VALUE="../Charts/FC_2_3_Column3D.swf">
<PARAM NAME="FlashVars" VALUE="&dataURL=Data.xml&chartWidth=700&chartHeight=350">
<PARAM NAME=quality VALUE=high>
<PARAM NAME=bgcolor VALUE=#FFFFFF>
<EMBED src="../Charts/FC_2_3_Column3D.swf" FlashVars="&dataURL=Data.xml&chartWidth=700&chartHeight=350" quality=high bgcolor=#FFFFFF WIDTH="700" HEIGHT="350" NAME="FC_2_3_Column3D" TYPE="application/x-shockwave-flash" PLUGINSPAGE="http://www.macromedia.com/go/getflashplayer"></EMBED>
</OBJECT>
</BODY>
</HTML>

As visible above, the columns have grown wider and adequate spacing is now present between each one of them.
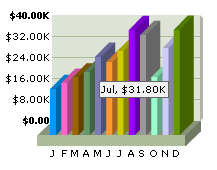
Now, suppose we wanted to resize the chart to a very small size (say 200x150 pixels). With this kind of size, placing the names, values, columns, div line values, limit values and all other chart elements would be too illegible. You won't be able to make out anything. So, we undertake the following before resizing it to such a small size:
- Hide chart caption and subcaption to give more vertical space
- Reduce data names length (like January to J, February to F and so on.) for clarity
- Add hoverText attribute for each set to show more information on tool tips
- Hide data values to to avoid cluttering
- Reduce all chart margins (top, left, right and bottom) to optimum (as required)
- Remove the div line values and the limit values (if required)
- Remove the x-axis and y-axis names
All of the above can be done via XML (we'll learn more on XML attributes later). We modify our previous XML data to the one below and save it as SmallChartData.xml.
<set name='J' value='17400' hoverText='Jan' color='0099FF' />
<set name='F' value='19800' hoverText='Feb' color='FF66CC' />
<set name='M' value='21800' hoverText='Mar' color='996600' />
<set name='A' value='23800' hoverText='Apr' color='669966' />
<set name='M' value='29600' hoverText='May' color='7C7CB4' />
<set name='J' value='27600' hoverText='Jun' color='FF9933' />
<set name='J' value='31800' hoverText='Jul' color='CCCC00' />
<set name='A' value='39700' hoverText='Aug' color='9900FF' />
<set name='S' value='37800' hoverText='Sep' color='999999' />
<set name='O' value='21900' hoverText='Oct' color='99FFCC' />
<set name='N' value='32900' hoverText='Nov' color='CCCCFF' />
<set name='D' value='39800' hoverText='Dec' color='669900' />
</graph>
<BODY bgcolor="#FFFFFF">
<OBJECT classid="clsid:D27CDB6E-AE6D-11cf-96B8-444553540000" codebase="http://download.macromedia.com/pub/shockwave/cabs/
flash/swflash.cab#version=6,0,0,0" WIDTH="200" HEIGHT="150" id="FC_2_3_Column3D">
<PARAM NAME=movie VALUE="../Charts/FC_2_3_Column3D.swf">
<PARAM NAME="FlashVars" VALUE="&dataURL=SmallChartData.xml&chartWidth=200&chartHeight=150">
<PARAM NAME=quality VALUE=high>
<PARAM NAME=bgcolor VALUE=#FFFFFF>
<EMBED src="../Charts/FC_2_3_Column3D.swf" FlashVars="&dataURL=SmallChartData.xml&chartWidth=200&chartHeight=150" quality=high bgcolor=#FFFFFF WIDTH="200" HEIGHT="150" NAME="FC_2_3_Column3D" TYPE="application/x-shockwave-flash" PLUGINSPAGE="http://www.macromedia.com/go/getflashplayer"></EMBED>
</OBJECT>
</BODY>
</HTML>

Exactly what we were looking for - small chart and all information present as hover caption (tool tip)!
Thus you just saw how easy FusionCharts makes it for us to resize the chart to any dimensions that we need to.